


Bitcoin is in the green on Friday, but traders appear unconvinced the rebound will hold.
The leading cryptocurrency is changing hands near $82,837, a gain of 1.38% over the past day. The move follows Thursday’s slide to $80,427, which marked its weakest price since early September. On prediction markets, bettors see a 67% chance that Bitcoin trades at or below $80,000 at some point during October.

Bettors remain skeptical of the rebound
On Myriad, the prediction market owned by Dastan, traders are positioned for additional weakness. Alongside the 67% odds of a dip to $80,000, its markets assign a 40% probability to Bitcoin hitting $77,500 this month and a 24% probability to it falling as far as $75,000.
In another market covering the week, the odds of Bitcoin closing above $87,500 stand at 49%. Read together, these wagers suggest a month of tightening price action with scope for more losses. Traders aren’t forecasting a collapse, but they aren’t expecting a breakout either.
Last week’s damage hasn’t been undone
The overall crypto market capitalization climbed 2.1% on Friday to $2.89 trillion, only partially repairing recent losses. Seven days earlier, the market was valued at more than $3 trillion, and Bitcoin was testing its yearly high.
Market mood has cooled in step. The Fear & Greed Index has slipped to 56, which is considered neutral, down from 71 on October 2, when it sat squarely in “greed” territory.
Institutional money is heading for the exits as well. Bitcoin ETFs recorded $484.9 million in outflows on Wednesday, their heaviest single-day loss since June 25, followed by a further $244 million in withdrawals on Thursday.

Momentum has faded, but the trend is still upward
Friday’s daily candle opened at $81,711 and has traded in a range between $81,553 and $83,443. On the four-hour timeframe, the price remains under the 50-period exponential moving average, meaning the short-term trend has yet to flip.
The daily timeframe tells another story. The Average Directional Index (ADX), which gauges how strong a trend is regardless of its direction, stands at 37.9, comfortably above the 25 threshold that signals a genuine trend. On the directional lines, buyers (DI+) are still ahead of sellers (DI-), so the trend remains bullish despite the recent retreat.
The Relative Strength Index (RSI), a 0-to-100 gauge of buying pressure, sits at a neutral 51.2, in line with the Fear & Greed Index. That points to Bitcoin cooling down after an overbought stretch rather than falling apart.
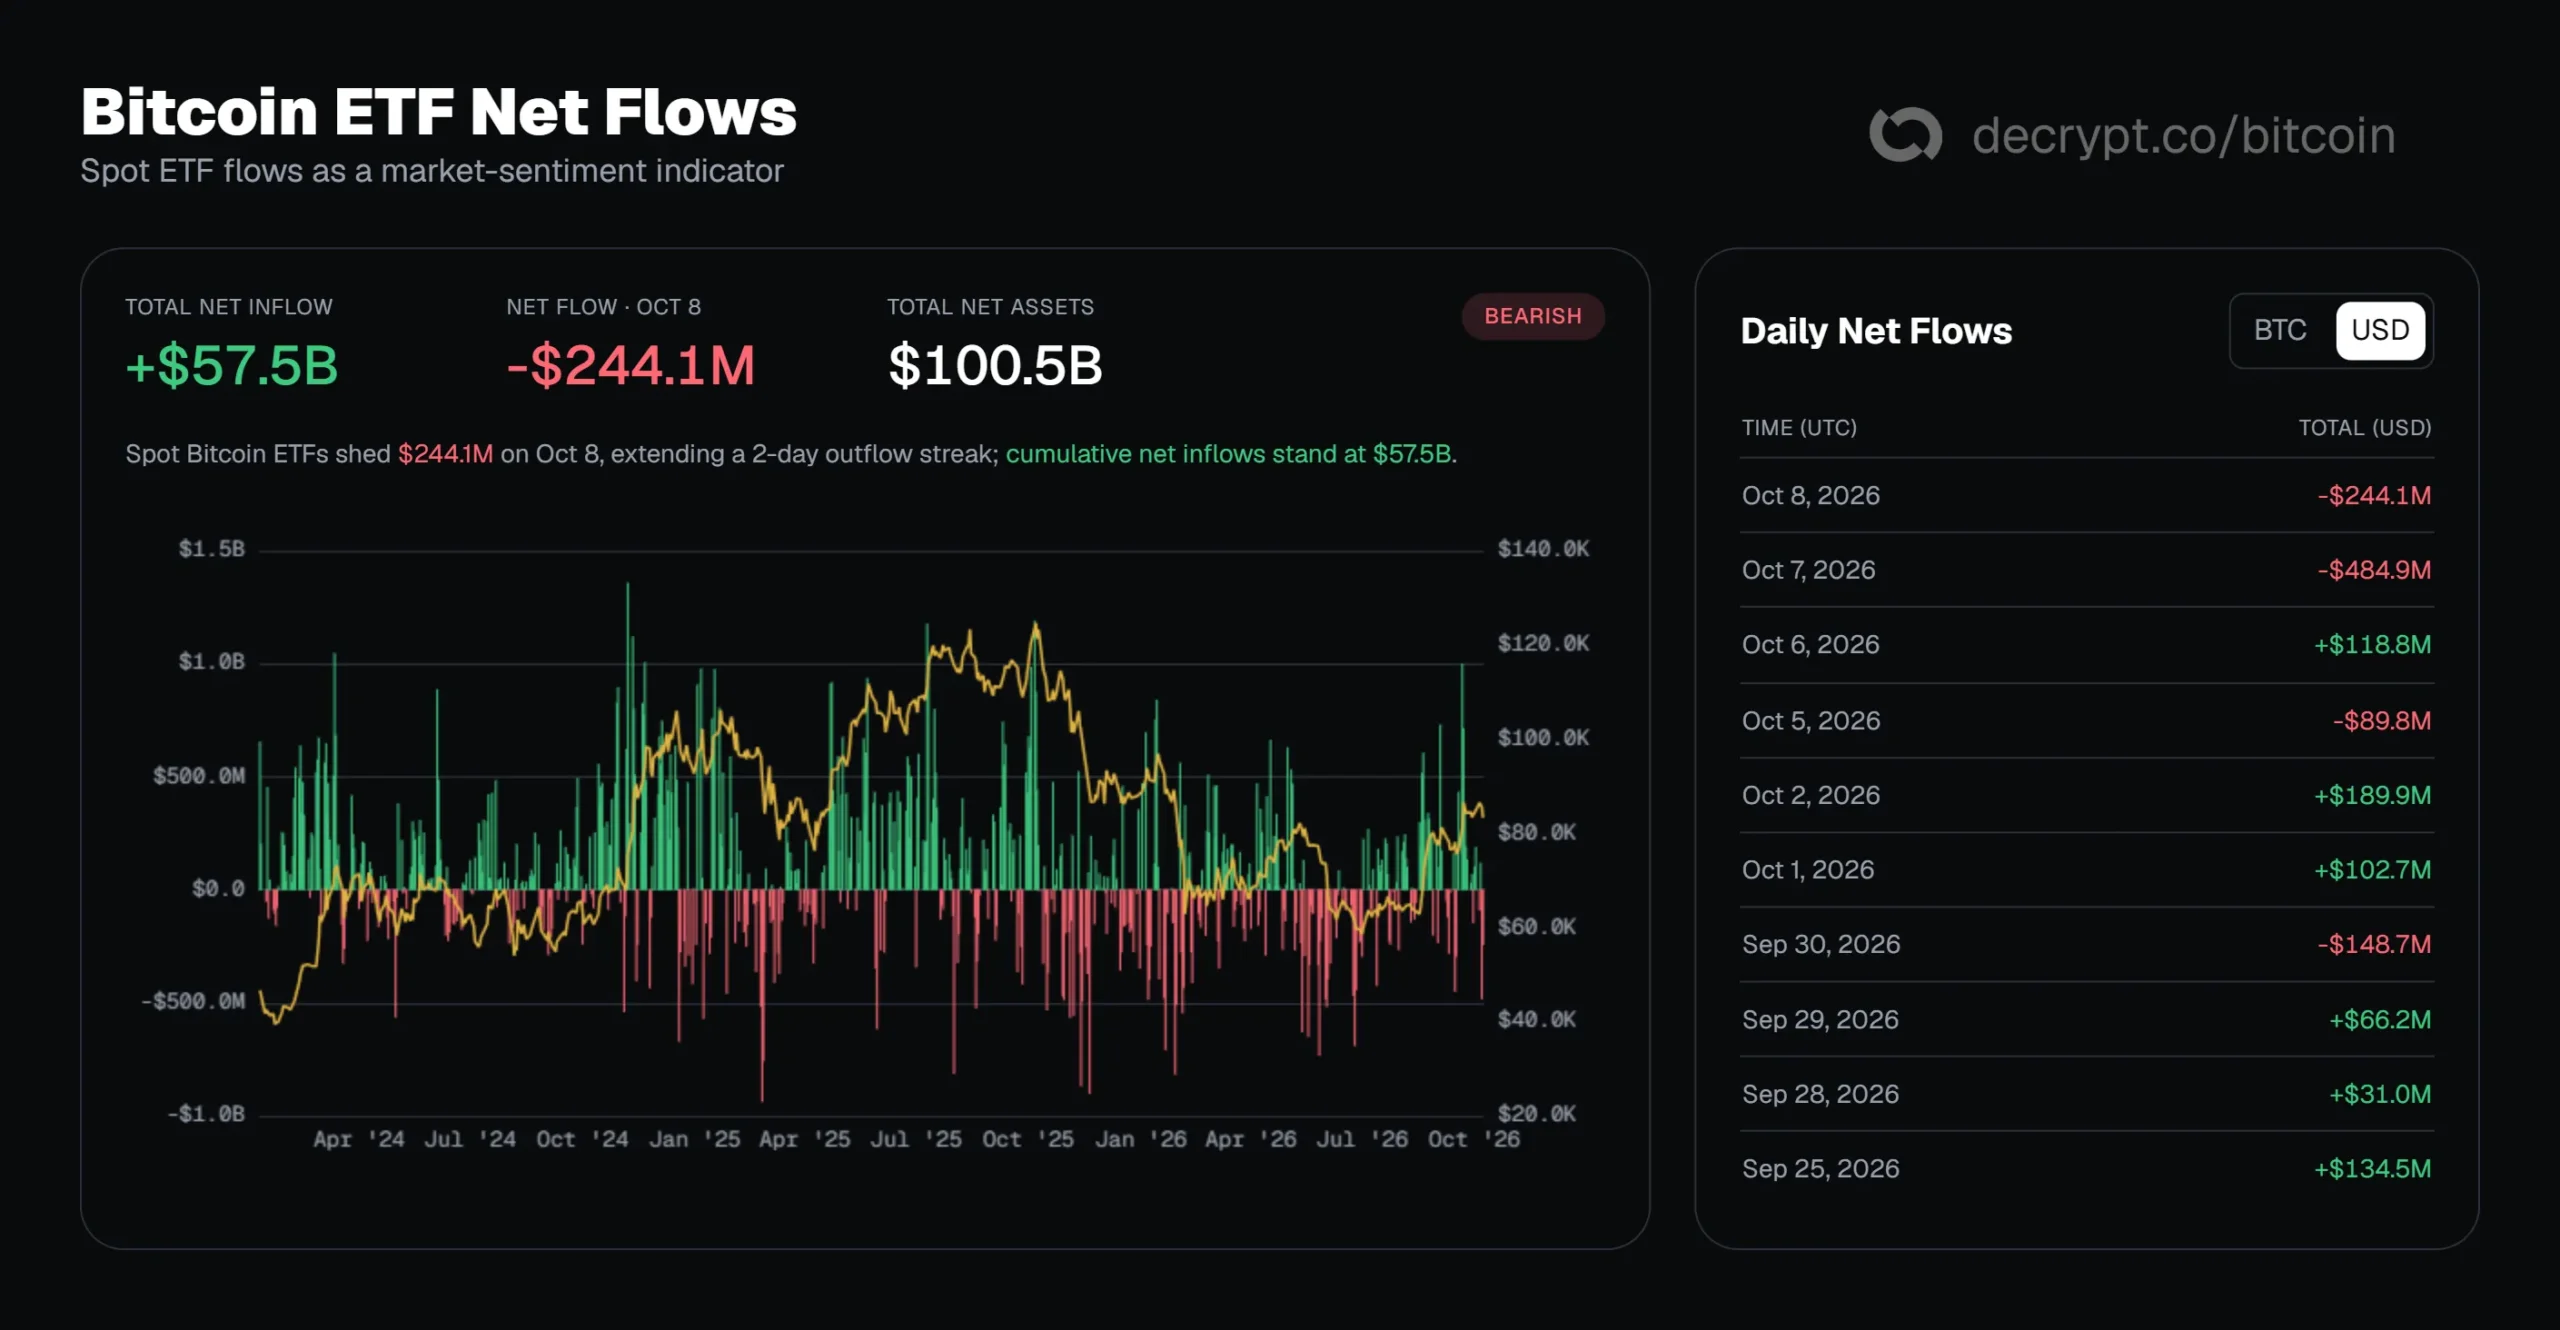
$83,000 is the first level to watch
According to Luke Deans of Bitwise Europe, the $83,000 area is where the average ETF cost basis meets the previous higher-high level, making it the first hurdle for the current rebound.
Should Bitcoin win back that level, the $84,433 zone becomes the next target. Beyond that, bulls need a daily close above the September high of $87,354.33, which acts as the ceiling.
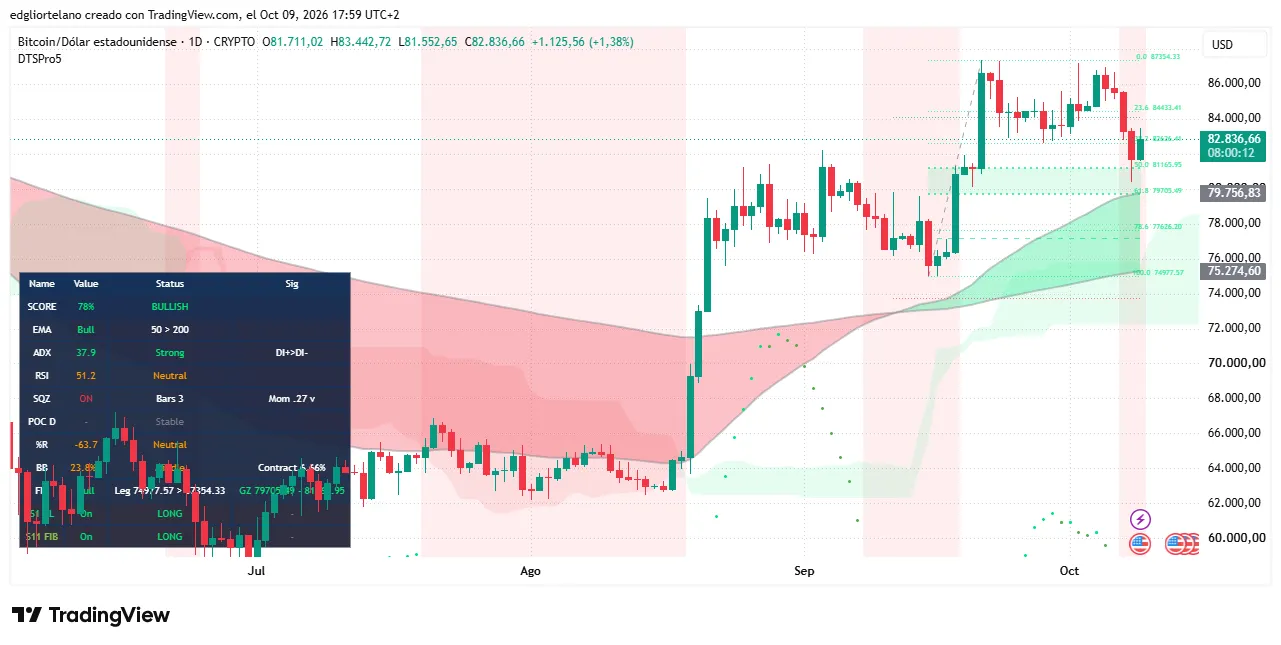
So far, Friday’s peak is $83,443, only just beyond the first threshold Deans identified, and the four-hour chart has yet to confirm a shift. Anyone tracking the move should hold off on calling a recovery until Bitcoin posts a daily close above $83,000.