

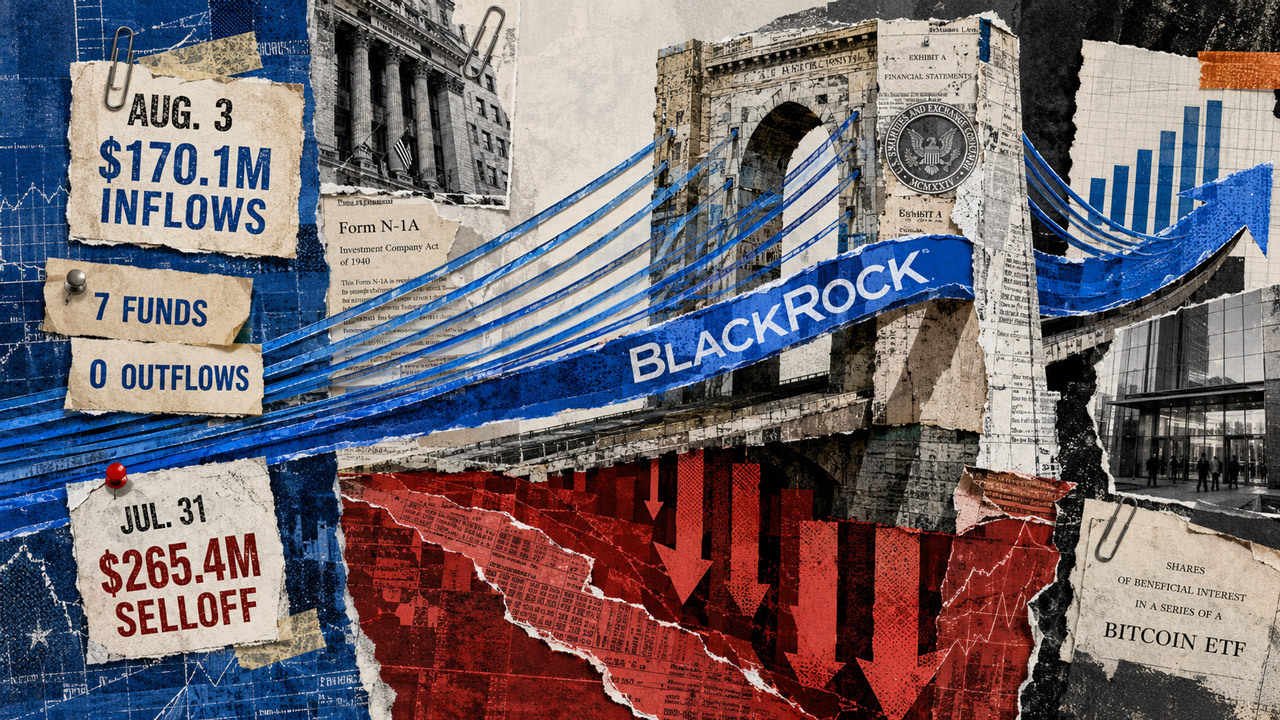
Two sessions. Two completely different pictures.
U.S. spot Bitcoin ETFs bled a net $265.4 million on July 31, with not one of the 12 funds managing a positive print. By Aug. 3 the board had reversed entirely: net inflows of $170.1 million, seven funds gathering cash, five unchanged and not a single outflow on the sheet.
That’s the headline. What sits beneath it matters more.
One fund is still most of the story
Of that $170.1 million, BlackRock’s IBIT accounted for $111.4 million. Run the numbers and roughly 65.5% of the day’s haul came from one issuer.
Add up the other six gainers and you get $58.7 million. Fidelity’s FBTC claimed $33.4 million of it, leaving the final five to divide something in the neighborhood of $25 million.
Farside Investors’ daily flow table puts EZBC at $9.2 million, BTCO at $6.7 million and HODL at $4.5 million. Trailing the group were BITB with $2.8 million and ARKB with $2.1 million. Flat lines went to BRRR, BTCW, MSBT, GBTC and BTC.
Sum those seven entries and you land precisely on Farside’s $170.1 million figure. Not one column showed a net redemption. A clean tape — and a badly lopsided one.

What the July 31 selloff actually looked like
Two sessions earlier the pain was distributed across five funds, and IBIT took its share: $122.7 million of net outflows from that fund alone.
FBTC gave back $54.8 million. GBTC logged $52.6 million in redemptions, the role it typically plays in these tables. BITB shed $17.8 million, ARKB $17.5 million.
There were no buyers at all that session. Zero of the 12 funds posted a net inflow.
Measured door to door, the July 31–Aug. 3 swing is worth about $435 million in direction, and the bounce clawed back roughly 64% of what had left.

We’ve seen this exact pattern days ago
Now for the detail that should cool anyone treating Aug. 3 as a break in trend. Identical breadth appeared on July 30, a single trading day ahead of the rout.
Seven funds in the green. None in the red. And a fatter number too: $233.1 million, roughly $63 million above what Aug. 3 delivered.
From there the count of positive funds dropped from seven to zero in one session, then snapped back to seven on Aug. 3. That isn’t a recovery curve. It’s a coin flip with a two-day memory.
The number to watch isn’t the total
Anyone using these flows to judge whether institutional demand is truly broadening is watching the wrong figure when they watch the daily total. Breadth, tallied across consecutive full sessions, is the metric that counts.
What Aug. 3 demonstrated is that money can find its way past IBIT. What IBIT’s 65.5% share demonstrated is that the spread remains heavily concentrated at the top. The same table supports both readings.
Multiple funds contributing positively over a stretch of sessions would make a far better case for broadening than a single green row following a red one. July 30 handed us a green row already, and it purchased exactly one day of staying power.

Context on the underlying asset
Over the trailing 24 hours Bitcoin is up 1.01%, and it holds rank #1 by market cap. Meaning the spot price isn’t doing much to explain any of this in either direction.
The real tell on Aug. 3 may be the five funds that printed zeros. BRRR, BTCW, MSBT, GBTC and BTC neither took in nor lost money, and for GBTC to go flat just two sessions after $52.6 million of redemptions is a real shift in that fund’s behavior.
Keep an eye on whether it holds. Over the span of a month, a GBTC that stops leaking moves the aggregate more than any one-day IBIT headline.
If you’re treating these tables as a signal, here’s my suggestion: quit screenshotting daily totals and start logging how many funds close positive, and for how many sessions running. Five or more funds green across three straight days would carry weight. A single day with seven carries whatever July 30 carried — which, as it turned out, was nothing.